When building Laravel web applications, it is almost impossible to avoid encountering bugs. If the errors ‘re just typing wrong or missing the semicolon you will fix them easily, but if the error are logical bugs, it will take you longer to fix. To discover the reason causes bug you can will need to dump a full SQL query for detecting the reason exactly. In this tutorial I will guide you some simple ways to show SQL Query log in Laravel.
Solution 1: Capture SQL Query Log in App Service Provider
Go to app/Providers/AppServiceProvider.php and add the following code:
public function boot()
    {

        /*........add this code to bottom boot function........*/

        if (env('APP_ENV') !== 'production') {
            DB::connection()->enableQueryLog();
            Event::listen('kernel.handled', function ($request, $response) {
                if ( $request->has('debug') ) {
                    $queries = DB::getQueryLog();
                    $formattedQueries = [];
                    foreach( $queries as $query ) :
                        $prep = $query['query'];
                        foreach( $query['bindings'] as $binding ) :
                            $prep = preg_replace("#\?#", is_numeric($binding) ? $binding : "'" . $binding . "'", $prep, 1);
                        endforeach;
                        $formattedQueries[] = $this->removeLineBreaks($prep);
                    endforeach;
                    dd($formattedQueries);
                }
            });
        }
    }
}

function removeLineBreaks(string $item){
   return str_replace(["\r\n", "\r", "\n"], ' ', $item);
}
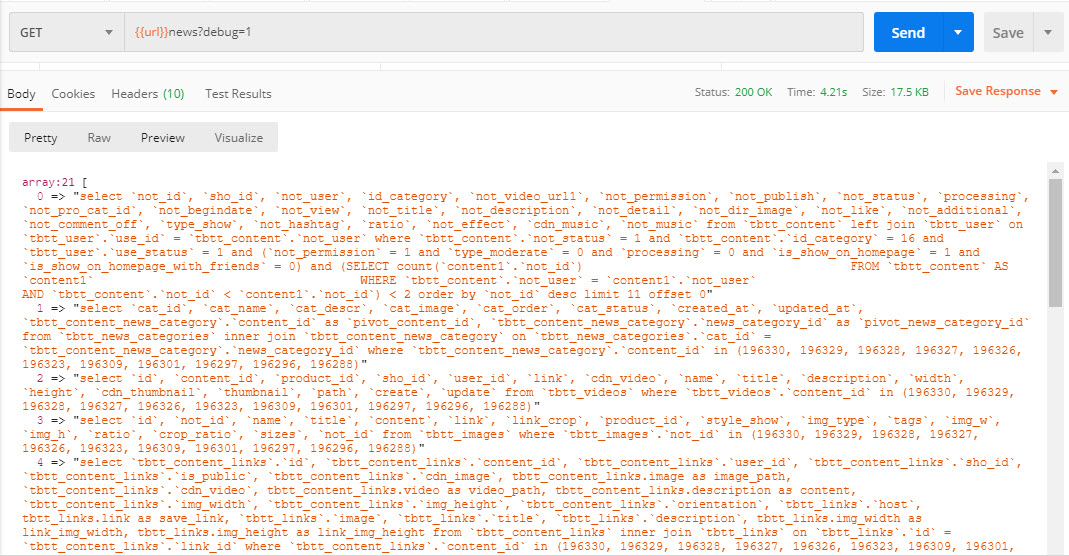
When you run Laravel web application in development environment and add a GET param debug=1 to the end of url, Laravel will listen Query Log and replace binding wildcard question mark by corresponding value. And finally we will collect an array contains all SQL query executed by web application like this:
Solution 2: Use Laravel Debugbar
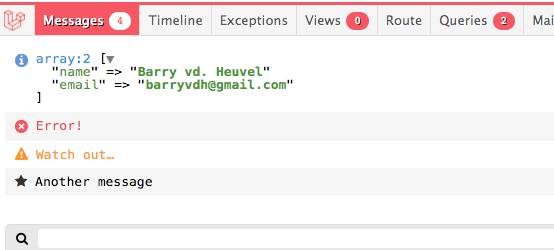
Laravel Debugbar adds a small bar at the bottom of the browser with debug information (e.g the number of queries). With Eloquent it can be easy to make unnecessary database requests so Debugbar helps to identify code that is not performance. It displays this right next to the developer console at the bottom of the browser.
Installing the Laravel Debugbar
In your Laravel 5 project require the package:
composer require barryvdh/laravel-debugbar
Next open config/app.php and inside the “providers” array add:
'Barryvdh\Debugbar\ServiceProvider',
Finally, if you wish to add the facades add this to the “aliases” array:
'Debugbar' => 'Barryvdh\Debugbar\Facade',
The Laravel Debugbar have some useful collectors can help you boost development speed.
- QueryCollector: Show all queries, including binding + timing
- RouteCollector: Show information about the current Route.
- ViewCollector: Show the currently loaded views. (Optionally: display the shared data)
- EventsCollector: Show all events
Apart from the core collectors, it includes a bunch of useful collectors that you can optionally enable:
- LaravelCollector: Show the Laravel version and Environment. (disabled by default)
- SymfonyRequestCollector: replaces the RequestCollector with more information about the request/response
- LogsCollector: Show the latest log entries from the storage logs. (disabled by default)
- FilesCollector: Show the files that are included/required by PHP. (disabled by default)
- ConfigCollector: Display the values from the config files. (disabled by default)
- CacheCollector: Display all cache events. (disabled by default)
You can learn more about this package, get full installation instructions at barryvdh/laravel-debugbar.